Table of Contents:
- Understanding Workflow Charts
- Why Use One?
- Benefits of Workflow Charts
- How to Create Workflow Charts
- Workflow Chart Types
- How to Automate Workflow
Introduction
You’ve probably heard the term “workflow” thrown around in meetings or read about the latest and greatest workflow management tools.
But what exactly is a workflow, and how can you optimize yours?
In short, a workflow refers to the sequence of steps required to complete a process or task.
And if you're looking a way to optimize your team's workflow and boost productivity, you need a workflow chart.
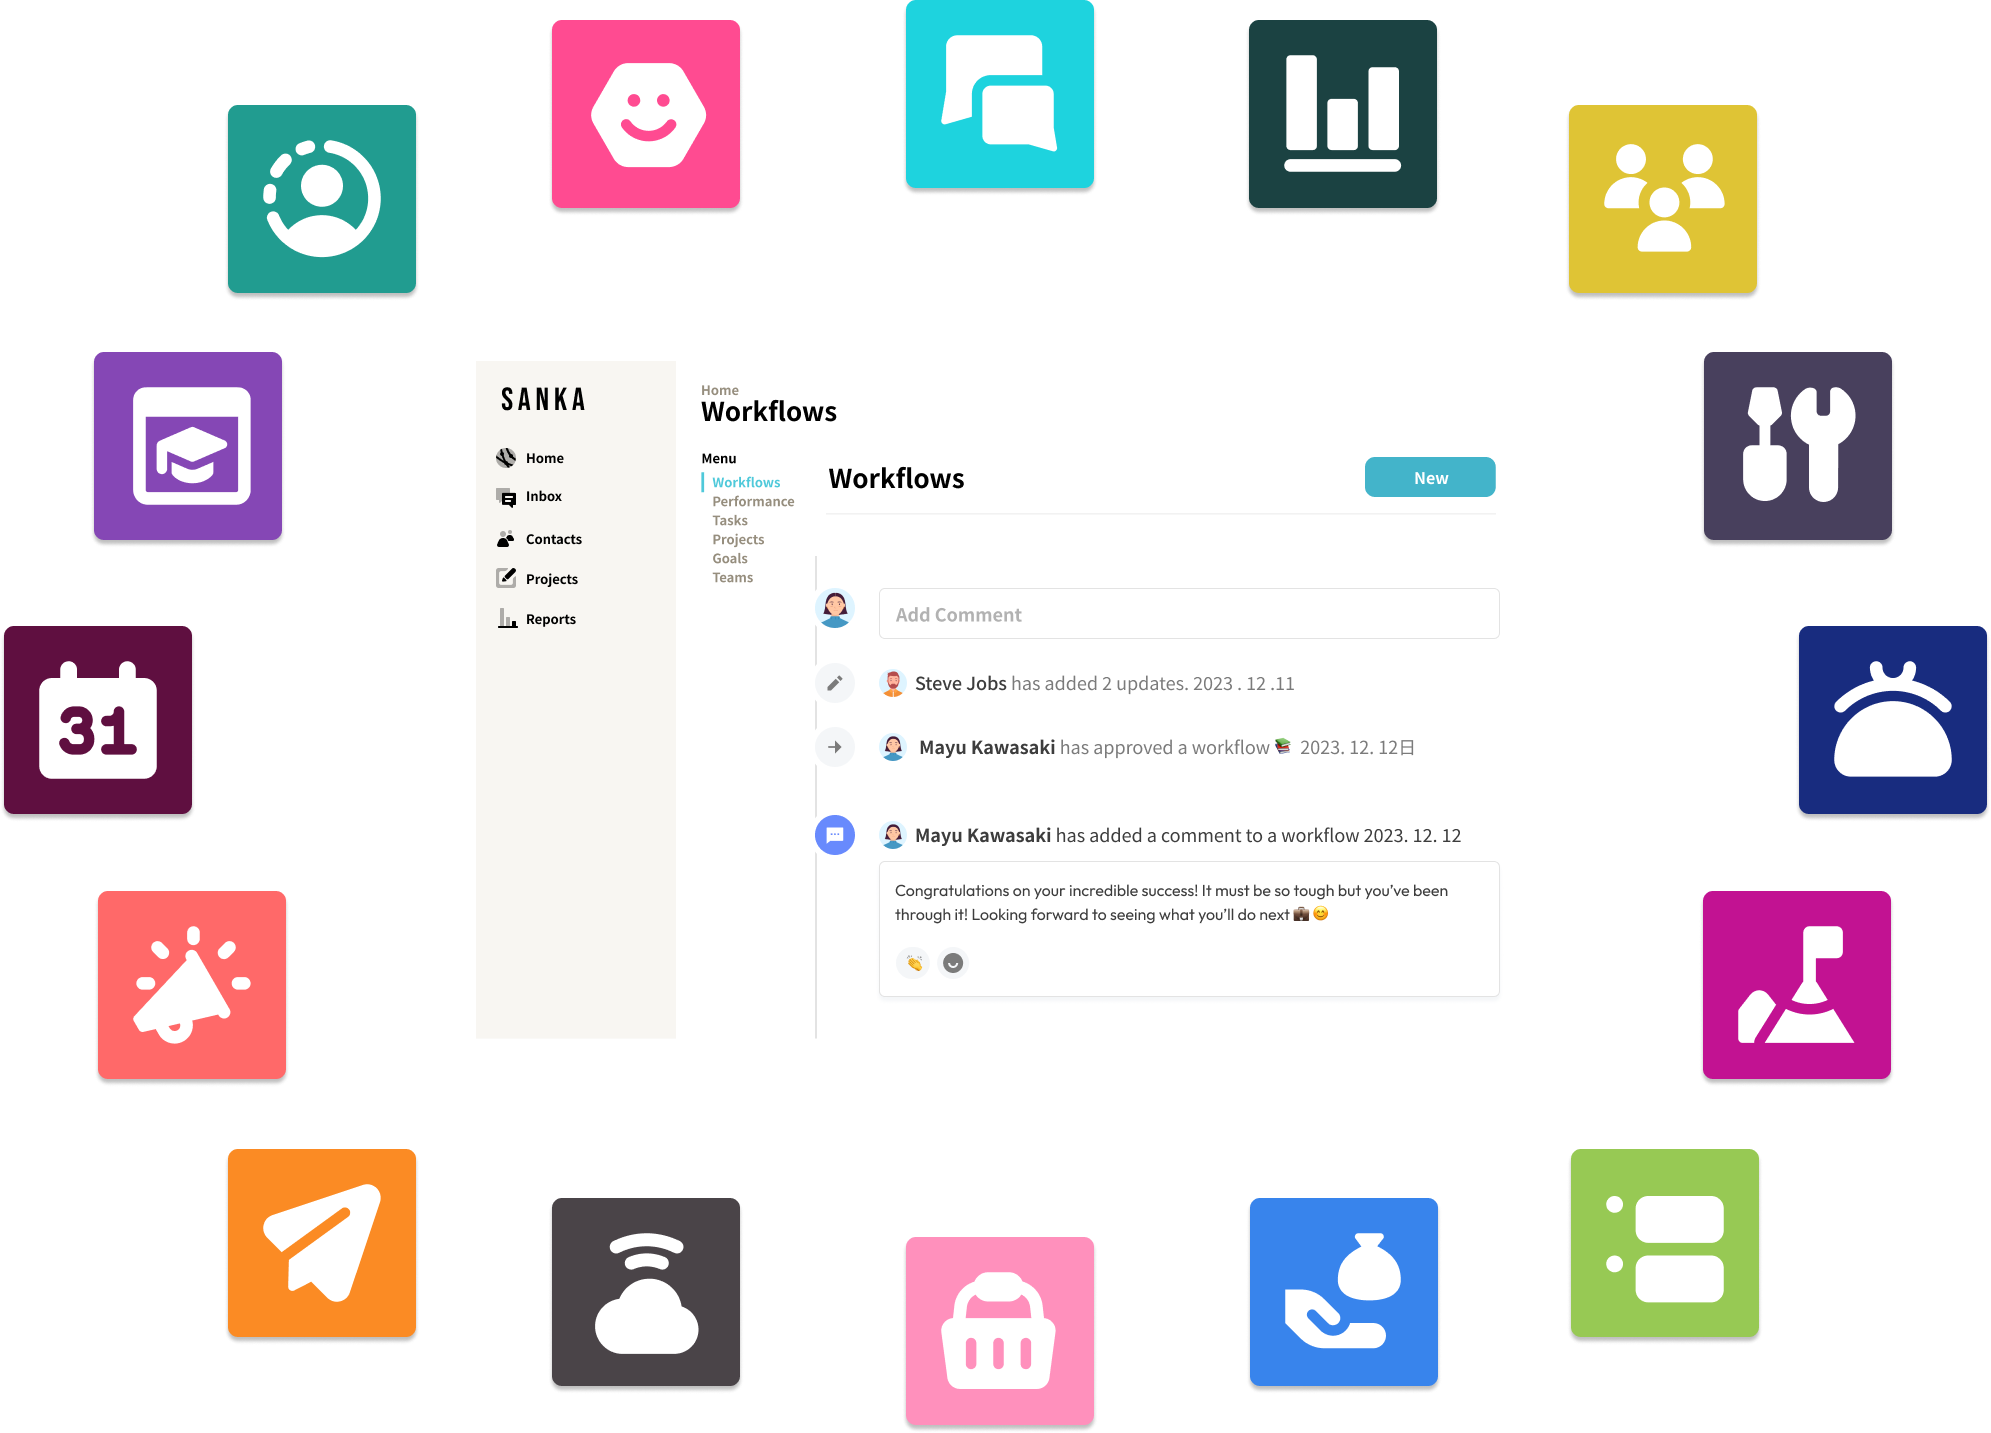
A workflow chart visually represents the steps required to complete a process. It shows you what needs to get done, by whom, and in what order.
Workflow charts are key to streamlining operations, eliminating inefficiencies, and achieving your goals faster.
In this guide, we'll walk you through everything you need to know about workflow charts, from what they are to how to make one.
We'll look at the main types of charts like swimlane flowcharts and cross-functional flowcharts.
We'll explore the benefits of using workflow charts for project management, business process improvement, and software development.
By the end, you'll be equipped with the knowledge and tools to map out and optimize any process.
Ready to take your productivity to the next level? Let's dive in!
Understanding Workflow Charts

Workflow charts, also known as workflow diagrams or flowcharts, are graphical representations of the sequence of steps required to complete a process or project.
They visually map out the journey from the starting point to the end goal, with each step represented by a specific symbol and linked with arrows to denote the order of operations.
Workflow charts are useful for documenting existing processes or designing new ones.
Why Use One?
A workflow chart visually represents the steps required to complete a process. It shows the flow of activities and the order in which they happen. Workflow charts are useful for:
- Streamlining and optimizing your processes. By mapping out the current steps, you can identify bottlenecks and inefficiencies. You can then reorganize or automate steps to create a smooth flow of work.
- Onboarding new employees. A workflow chart provides an easy-to-understand overview of how a process works. This helps new hires get up to speed quickly.
- Collaboration and alignment. A shared workflow chart ensures all stakeholders have the same understanding of how a process should function. This results in more efficient cross-functional work.
- Documentation and compliance. Workflow charts provide a standardized way to document your processes. This is important for meeting regulations and quality standards.
- Improving productivity. An optimized workflow with clear procedures helps employees work more productively. Less time is wasted figuring out what to do next.
To create a workflow chart, start by listing all the steps in the process. Then determine the correct order and organize them visually.
Use arrows to show the flow and direction. Add decision points where alternative paths can be taken. Number the steps and include a short description for each one.
Keep your workflow chart simple but detailed enough to be useful. Place it in an area where employees can easily refer to it.
Be open to revising it as needs change to keep your processes running as efficiently as possible.
Benefits of Workflow Charts
Creating a workflow chart has several benefits. It helps you gain a high-level view of the overall process so you can spot any inefficiencies or issues.
It also makes the process easy to understand for anyone involved, improving communication and ensuring everyone is on the same page.
Workflow charts are ideal for onboarding new team members as they provide a quick overview of how things work.
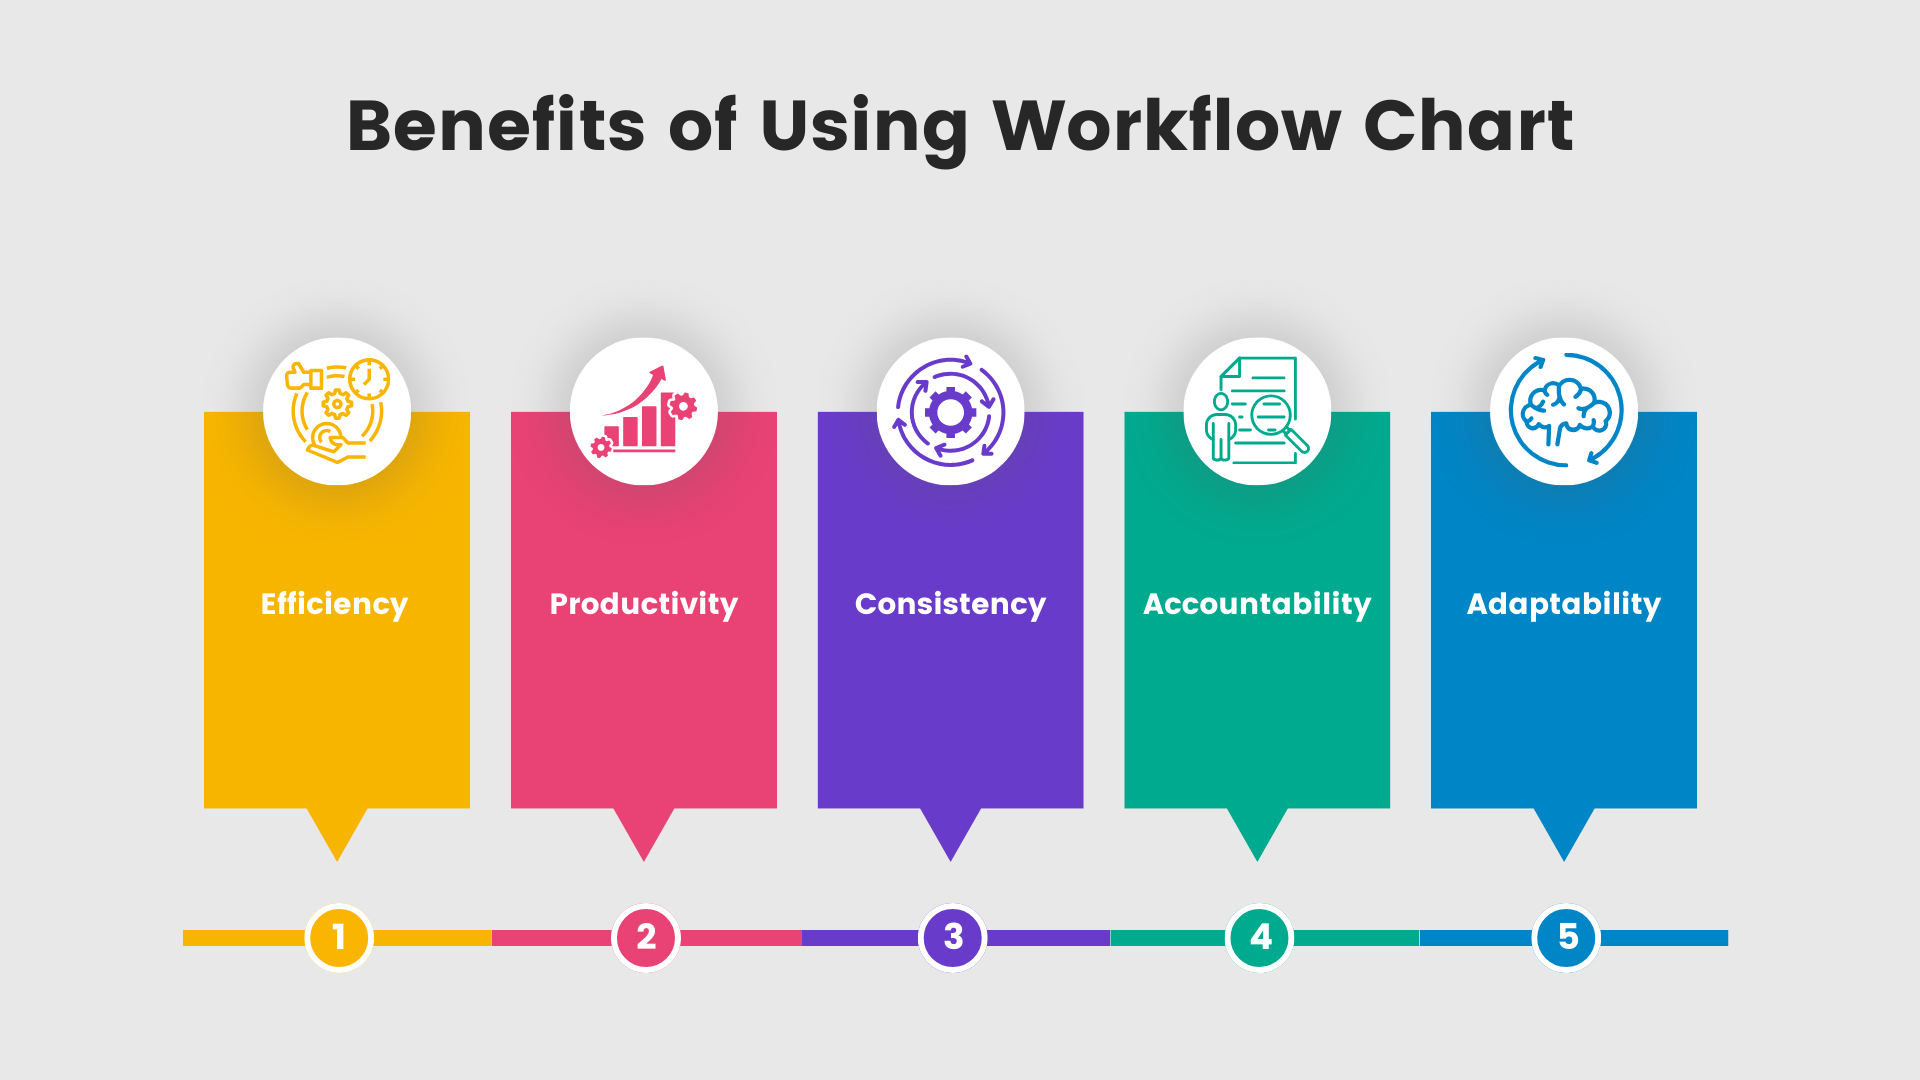
Here are some key benefits of using workflow charts:
- Improving Understanding: Workflow charts provide a clear visual representation of a process, making it easier for everyone to comprehend the steps involved, their sequence, and any dependencies or interrelationships. This enhanced understanding can promote collaboration and effective communication among teams.
- Optimizing Efficiency: By clearly representing a process, workflow charts can help identify redundancies or bottlenecks in operations. With this insight, it's easier to spot areas where efficiency can be improved.
- Enhancing Training Resource: For new team members or those stepping into new roles, workflow charts can serve as valuable training resources. They can quickly grasp the nuances of a process and follow the path that leads to a task's successful completion.
- Better Decision-Making: Workflow charts make it easier to understand what happens at each step, including decision points. This clarity can result in better-informed decisions, which in turn positively impacts productivity.
- Enabling Consistency: Following a standardized process is key to producing quality-controlled and consistent results. Workflow charts provide a well-defined structure to a process, ensuring repeatability.
- Facilitating Communication: Sharing a workflow chart helps align all stakeholders on a project or process. It provides a universal 'language' ensuring everyone understands the tasks, roles, and flow of activity.
- Helping with Compliance: For certain industries, adhering to specific processes may be mandatory for compliance with established regulations or standards. A workflow chart can help illustrate that these requirements are being met, lowering the risk of non-compliance.
- Serving as a Blueprint for Automation: Workflow charts can serve as stepping stones to workflow automation. By charting out the process, organizations can identify what can be automated.
In conclusion, workflow charts are an essential tool for visualizing business processes, enhancing understanding, planning, communication, productivity, and ultimately leading to improved business operations.
How to Create Workflow Charts

Embarking on the journey to create a workflow chart? Here's a simple step-by-step guide:
- Identify the process. Determine the specific process you'd like to visualize - this could be the overall software development life cycle, a feature development process, a testing phase, or a bug-fixing process.
- List all the steps in the process. Don't leave anything out - capture all the details, no matter how small. Review the list to ensure it's complete and in the proper order. You can reorganize the steps at this point if needed.
- Decide on the appropriate flowchart shape for each step. The most common shapes are rectangles (for tasks or actions), diamonds (for decisions), and arrows (to show direction of flow). Use a key to define what each shape represents.
- Connect the shapes to show the sequence and relationships between steps. Arrows indicate the direction of the flow through the chart. Add labels to clearly show how one activity leads to the next.
- Review and validate your workflow chart. Double-check that no steps are missing and the flow makes logical sense. Get input from others involved in the process. Make any final changes needed before publishing the chart.
Don't be shy to use technologies like Microsoft Visio, Google Drawings, or specialized tools such as Lucidchart and Draw.io to design professional and easy-to-follow charts.
Workflow Chart Types
Various types of workflow charts or diagrams are available for representing different processes.
Each type can be employed depending on the complexity of the process, detail level required, and desired visual impact.
Here are five common types of workflow charts/diagrams:
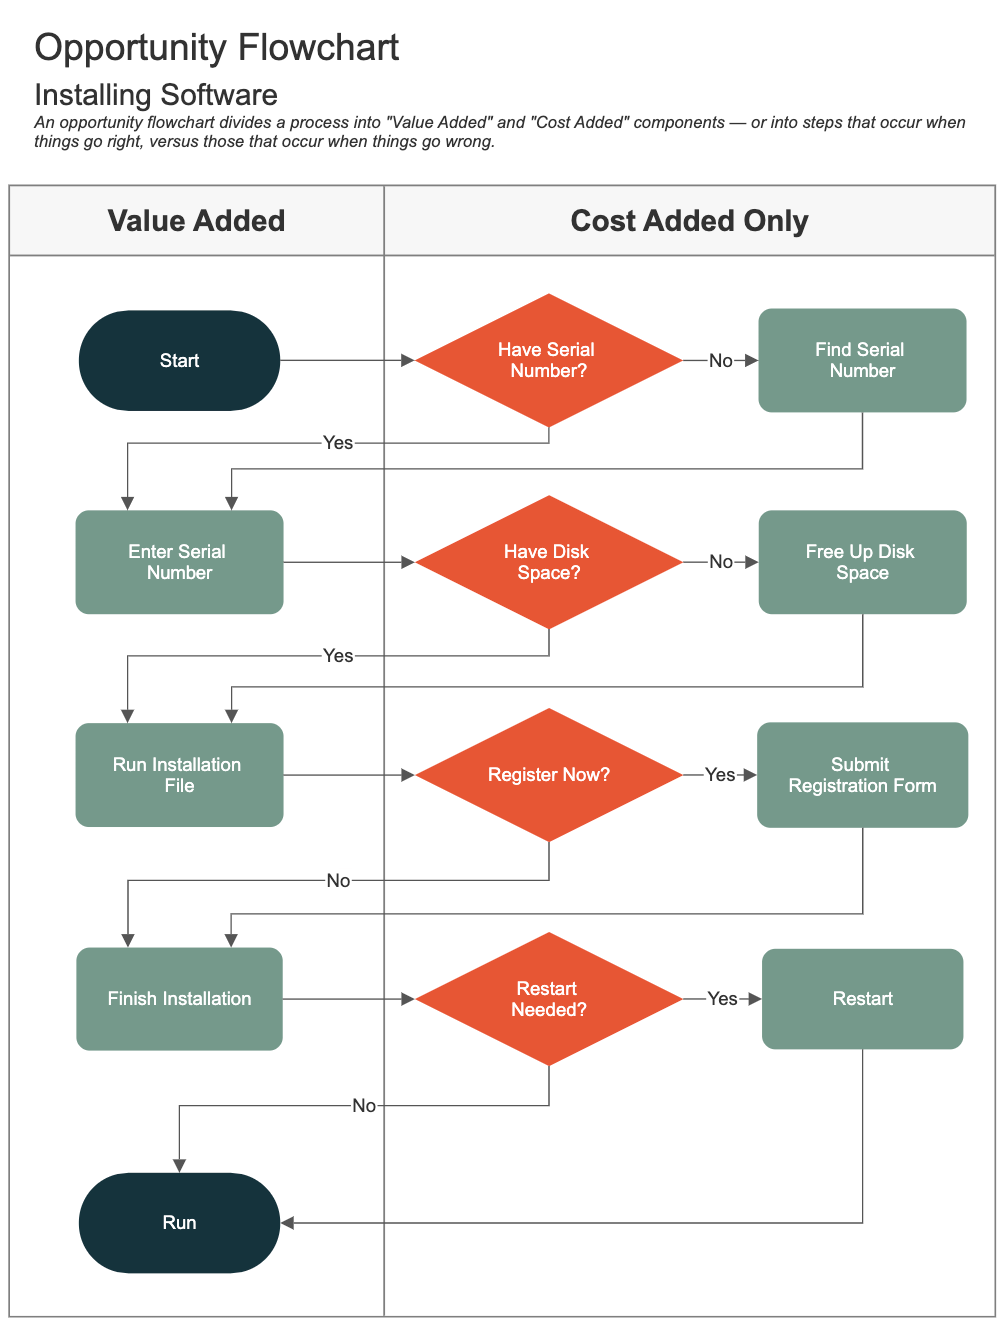
Flowcharts
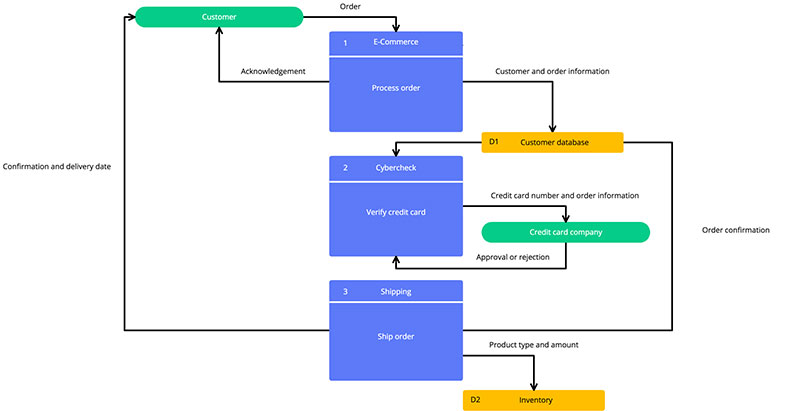
Flowcharts are among the most widely used workflow diagrams, as they easily depict the sequence of steps within a process and can be applied to any industry and function.
These charts incorporate geometric shapes like rectangles (representing processes), diamonds (for decision points), and arrows (indicating the flow direction).
Swimlane Diagrams
Also known as cross-functional flowcharts, swimlane diagrams divide the diagram into sections—each dedicated to a specific role, department, or team.
These diagrams are useful for visualizing processes that involve multiple departments or roles and clarifying responsibilities.
Business Process Model and Notation (BPMN)
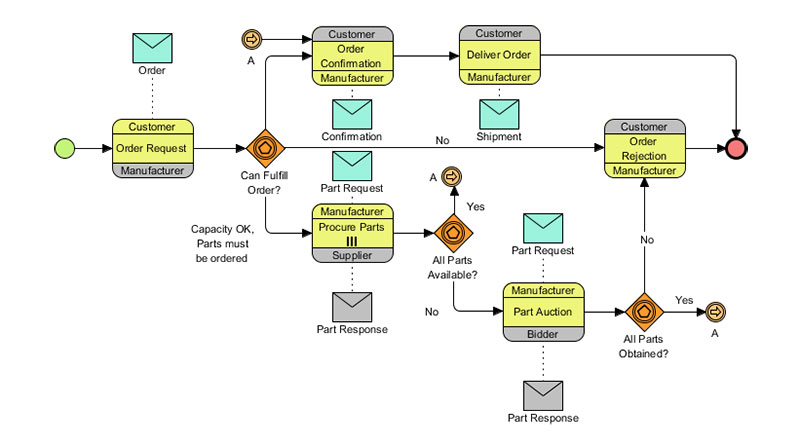
BPMN is a standardized notation system for modeling business processes. It was designed specifically for process modeling in businesses and includes a rich set of symbols for visually representing workflows.
BPMN diagrams are useful for capturing complex business processes and can be executed on a BPMN engine.
State Diagrams
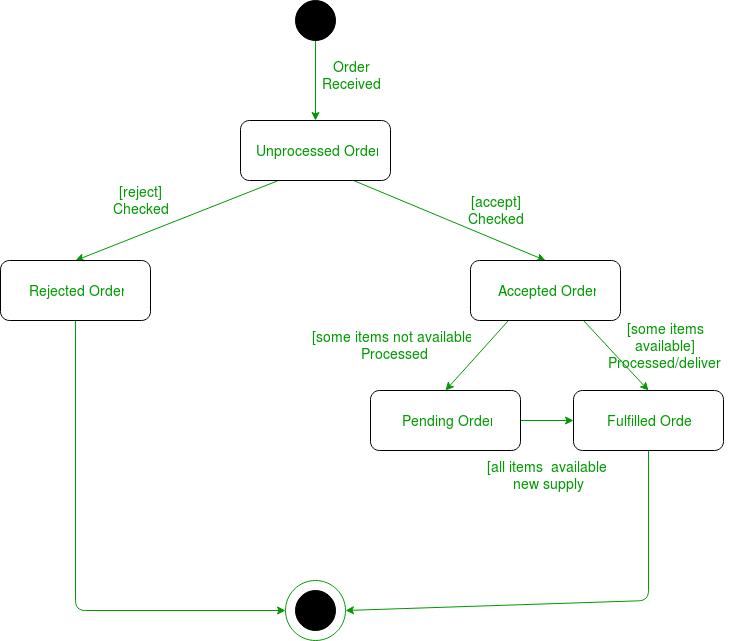
Also known as state-transition diagrams or state machines, state diagrams illustrate the various states an object or system can have and the transitions between them.
They're particularly helpful for modeling complex dynamic systems, such as computer programs, and can include conditional statements.
Gantt Charts
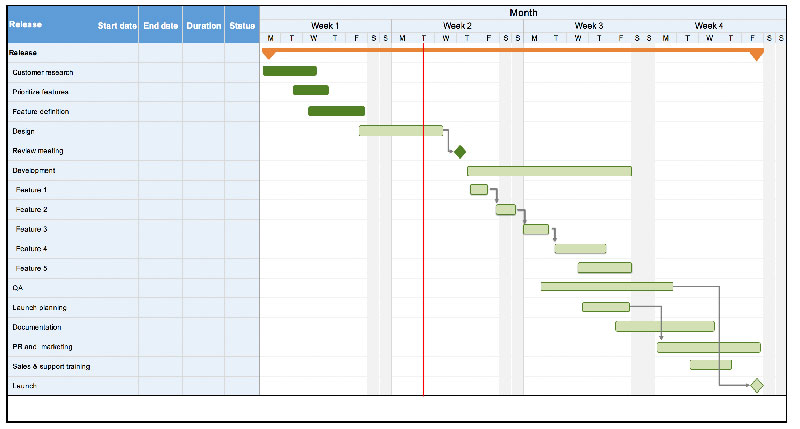
Gantt charts are horizontal bar charts that display project schedules, showing the timespan of individual tasks and their relationships.
These charts are beneficial in project management, enabling organizations to track project progress and adjust work sequences if needed.
Each of these workflow diagram types serves a specific purpose. Selecting the most appropriate type depends on the nature of the process and the kind of information needed to be communicated.
How to Automate Workflow

Workflow automation is a strategy used by businesses to streamline their processes, reducing reliance on manual tasks and making workflows more efficient and accurate.
Here's a step-by-step guide on how to automate a workflow:
Identify the Process for Automation
The first step is to identify which process would most benefit from automation.
This could be a process that is time-consuming, prone to errors, repetitive, or critical to business operations.
Document the Current Workflow
Before automating the process, write down all steps, decisions, tasks, roles, and outcomes associated with the process.
Having a detailed workflow chart or diagram can be beneficial here. Take note of bottlenecks, inefficiencies, and areas for possible improvement.
Define the Desired Outcome
Understand the specific goals of automation. This could range from eliminating errors, enhancing speed, achieving consistency, saving time, or improving customer service.
Choose the Right Workflow Automation Tool
There are numerous workflow automation tools available. The best one would cater to the specific needs of your business, have a user-friendly interface, offer integration options, and fit within your budget.
Consider tools like Sanka, Zapier, Asana, Process Street, Trello, Airtable, or Monday.com.
Design the Automated Workflow
Using the selected tool, design your automated workflow.
At this stage, you'll configure the tasks, rules, and criteria required - most tools offer features like if-this-then-that (IFTTT) rules or conditional workflows to increase automation depth.
Testing
Before full implementation, test the automated workflow. Make sure it behaves as expected, all integrations work properly, and the system is user-friendly for those who will work with it daily.
Implement and Train
Roll out the automated workflow and make sure all relevant stakeholders are trained on how to use it. Keep an open communication line for continuous feedback.
Review and Optimize
Regularly review your workflows, track the performance, and look for areas of improvement. Support continuous optimization, as business operations and needs evolve.
Remember that automation can significantly streamline your business processes, but it's not a one-size-fits-all solution.
The best approach is to start small, experience some early successes, and grow your automated processes from there.
Conclusion
Well, there you have it. Now you know what a workflow chart is, why it matters, how to build one, and some examples to get you started.
The key takeaway here is that workflow charts can help you gain serious efficiencies and improve how work actually gets done in your team or organization.
Whether you're in software engineering, marketing, HR, or any other field, mapping out and optimizing your processes with a workflow chart is a skill that will serve you well.
So take this knowledge and run with it - build your first workflow chart, streamline a messy process, and revel in how much simpler and smoother things can be when you take the time to chart your flow. You've got this!